Who decides what you get good at?
How much of what we become good at is a choice, and how much is shaped by the roles we happen to occupy?
I like building things. I’m still figuring out the rest.
This is where I write about work, learning, and whether what we build is helping people.
How much of what we become good at is a choice, and how much is shaped by the roles we happen to occupy?
During an air-quality module in my MSc, I started using R and open-source libraries. I still remember how cool it was to build the graphics from scratch. That work became my MSc thesis, and later a paper I coauthored with my supervisors.
The air-quality paper Sayegh, Tate & Ropkins · Atmospheric Environment, 2016
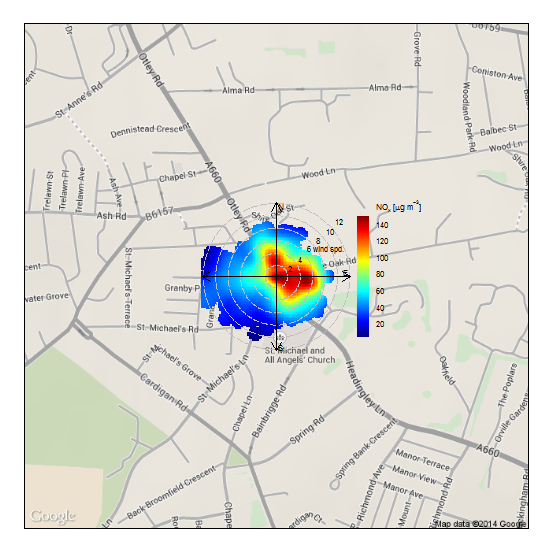
A660 Headingley, Leeds. Colour shows NOx concentration, angle shows wind direction, and radius shows wind speed. The map and plot use different scales.
Sayegh, Tate & Ropkins · EPUK presentation, 2014. Plotted with openair (Carslaw & Ropkins, 2012).
Maths was much harder than I expected.
I chose it because I thought I was good at it. It was mentally tough, but I liked the logical thinking. Transport planning came next, by chance, followed by an MSc and a PhD.
At Virgin Media, I helped build the data platform behind a real-time location product in O2 Motion. One use was estimating crowd sizes during the 2022 Jubilee from anonymised, aggregated mobile-network data.
The Jubilee crowd estimates Wales Online · June 2022
Before that, I had no idea how real-time insights were delivered. Working with data engineers and colleagues in sales and product, I learned how to design a platform that could grow with demand, and how critical the data could be during live events.
I like changing topics and working with different people. I’ve been fortunate to have room to experiment and take risks. That shaped how things went for me.